文章导航
研一下英语小班实践资料:peer review和presentation
Review Comments
Title: Design and Implementation of Big Data Analysis Method for Short-term Stock Trend Prediction
Author: Shupei Li
Reviewer: Zehua Ren 3121154002
Work overview
This paper proposes a stock price prediction algorithm based on LSTM (Long Short Term Memory) classifier. First, the continuous data is discretized, then 14 groups of discrete data types are reduced by decision tree algorithm to eliminate useless data types, and then the reduced attributes are put into the LSTM classifier for training and prediction. In addition, non-technical indicators are added to the model to improve the accuracy of the model.
Writing level
Strengths
- The research problem is meaningful, and the proposed solution is technically correct.
- This paper is clear and easy to understand.
- The article combines the results of the experimental analysis to make the conclusion more convincing.
Weakness
Formatting issues:
The first letter of the word after the semicolon should be lowercase.

The font size of this two paragraphs is not uniform.

Express problem:
The paper does not list what the other properties are, which may confuse readers.

Grammatical errors:
There are some "A" in this paragraphs which is strange. Consider remove some of them and change others into lowercase.

The last highlighted word might be non-technical according to context.

Typography issues:
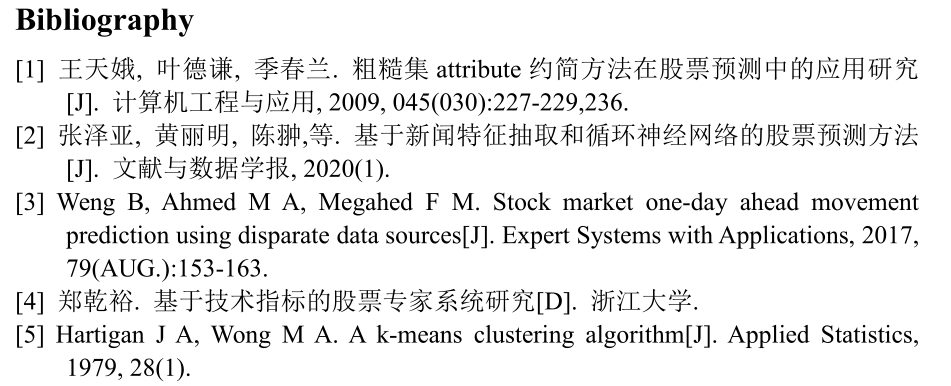
Please use the IEEE two-column template and translate Chinese references into English.

Formula problem:
The symbol a is used in the left of equal sign but it does not appear in the right side, while there are several
in the right. Consider change the superscript into a or explain in the text.

Technical level
Strength
The discretization method used in this paper characterizes the stock price changes well. The author demonstrate the effectiveness of one-dimensional clustering discretization method using both theoretical reasoning and experimental verification.
Questions
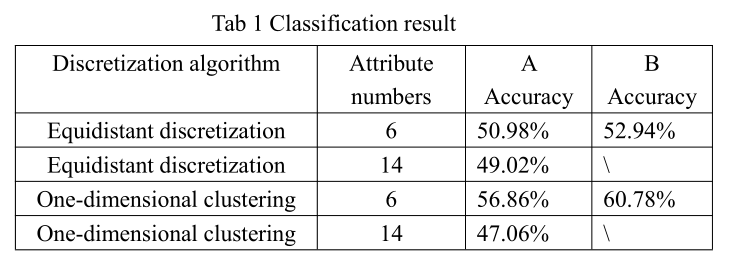
There are lack of results in 14 attribute situation when non-technical indicators are added into the model. Is it a technical reason? Hope to explain in the text.

How does the non-technical indicator part affect the forecast results? How do these unquantifiable factors act quantitatively on the predictive model?
The Equidistance bulk chemical method is not explicitly stated in the text. Please explain it in revised manuscript.

Some doubts:
This method tries to fit the stock trend curve, but there are many random factors in the stock market, and this method does not seem to take the effect of randomness into account. Combining stochastic process analysis to give confidence intervals seems to be a better approach. Otherwise, the model may be overfitting, and some features of random interference may be learned and cannot make more accurate predictions.
Proposed changes
Add related work to illustrate the innovation of this paper in this field.
Draw the overall flow chart for easy understanding.
Such as:

Add a comparison with other methods to demonstrate the effectiveness of this method.
Consider using tables to present.
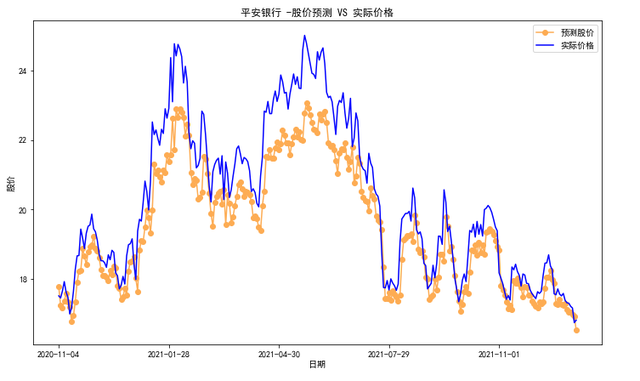
The prediction effect can be displayed visually by drawing a comparison curve between the real data and the predicted data.
Such as:

Reference articles
其他资料
论文原文:work
review内容:PPT
presentation:PPT


